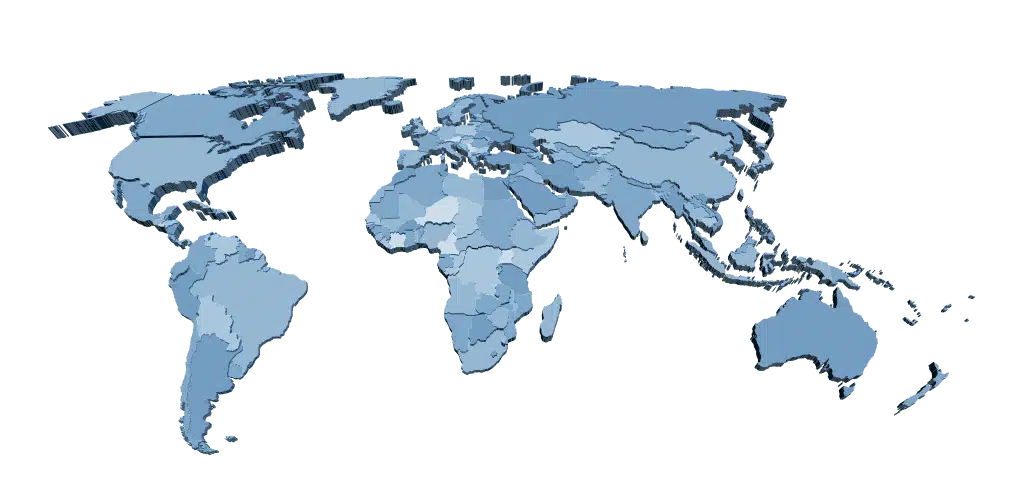
10 Strongest Economies
GDP has always been the famous and most reliable metric for estimating the sizes of different world economies. It generally represents the value of all goods and services produced within a nation annually. There are different variations, but it has allowed economists to understand the relative sizes of various world economies. The world’s largest economies have a massive influence on global finance and trading. For context, the top 10 largest economies account for over 66% of the worldwide economy.
How to Evaluate a Country’s Economy
Macroeconomic indicators provide valuable cues about the prevailing factors in the market and possible future trends. Here are some of the key macroeconomic indicators to consider when evaluating the economies of different countries:
Gross Domestic Product (GDP)
GDP is the broadest of all macroeconomic indicators. It measures the monetary value of all final goods and services produced in a country within a specific period, usually quarterly or annually. There are many approaches to calculating GDP:
- GDP per capita.
- GDP by country.
- Expenditure (the total spending of different economy participants).
- Production (while expenditure focuses on input, production focuses on output cost).
- Income (a hybrid of the two that focuses on the income earned or generated by various economic factors).
For comparison, there is usually Nominal GDP and Purchasing Power Parity-adjusted GDP. Nominal GDP is straightforward and typically adjusted to US dollars using prevailing market exchange rates. On the other hand, PPP is designed to estimate the difference in the cost of living in different countries. It does so by comparing the prices of baskets of goods and services after adjusting the exchange rates.
Consumer Price Index (CPI)
CPI measures the weighted average of a basket of vital goods and services such as food, healthcare, and transportation. CPI is the primary measure of inflation and deflation on both the consumer and producer level. CPI is one of the most essential indicators watched by monetary policymakers, such as central banks.
Unemployment Rate
The unemployment rate is the percentage of the labour market without a job. While it is generally considered a lagging indicator, it provides information to help policymakers and investors make good decisions. For instance, when the unemployment rate is getting higher, policymakers, such as government and central banks, can make decisions to boost the economy. In contrast, investors can examine the sectors losing jobs to execute exit strategies.
2025 Snapshot & Rank Updates (IMF WEO)
Top 10 by Nominal GDP (current US$), 2025 (IMF est.)
Rank | Economy | GDP (US$ tn) |
1 | United States | 30.51 |
2 | China | 19.23 |
3 | Germany | 4.74 |
4 | India | 4.19 |
5 | Japan | 4.19 |
6 | United Kingdom | 3.84 |
7 | France | 3.21 |
8 | Italy | 2.42 |
9 | Canada | 2.23 |
10 | Brazil | 2.13 |
Source: IMF World Economic Outlook, April 2025 (via compiled table).
Top 10 by GDP (PPP, international $), 2025 (IMF est.)
Rank | Economy | GDP (Int$ tn) |
1 | China | 40.72 |
2 | United States | 30.51 |
3 | India | 17.65 |
4 | Russia | 7.19 |
5 | Japan | 6.74 |
6 | Germany | 6.16 |
7 | Indonesia | 5.01 |
8 | Brazil | 4.96 |
9 | France | 4.50 |
10 | United Kingdom | 4.45 |
Source: IMF World Economic Outlook, April 2025 (via compiled table). Data rounded to 2 d.p.
What changed (fast facts)
- India nudges into #4 (nominal) ahead of Japan by roughly $0.59bn on IMF 2025 estimates — a razor-thin margin that could flip with FX moves.
- Germany holds #3 (nominal) after overtaking Japan in recent years; the yen’s weakness continues to compress Japan’s USD GDP.
- PPP rankings emphasise scale effects: Russia sits #4 and Indonesia #7 on PPP even though they’re outside the nominal top six, underlining price-level adjustments.
Data & transparency note
Data reflect IMF WEO (April 2025 edition). Nominal GDP is in current US dollars; PPP uses international dollars.
Values are IMF estimates/projections and may be revised; for the latest historical actuals, cross-check with World Bank GDP (current US$). Data as of April 2025 (IMF WEO).
World’s 10 Largest Economies
USA
Nominal GDP: $30.51 trillion
GDP (PPP): $30.51 trillion
The USA is the largest economy in the world by nominal GDP, and its currency (the US dollar) is the most powerful and the most used, both in circulation and reserve. The country has a well-diversified and open economy, with services being the most significant contributor to its GDP. Furthermore, the US is currently the world’s dominant political power, and it can dictate the global economy literally.
Some of the biggest companies in the world, such as Apple, Microsoft, Amazon, ExxonMobil, Visa, and Coca-Cola, are all domiciled in the US. Its stock exchanges, NYSE and NASDAQ, are also the biggest globally. Despite its enormous successes, the US economy faces threats such as rising healthcare and social security costs and widening economic inequality.
China
Nominal GDP: $19.23 trillion
GDP (PPP): $40.72 trillion
China is the second-largest economy in the world by nominal GDP and one of the biggest countries in the world in terms of PPP. In the last four decades, China has implemented policies that have seen the country consistently close the gap between itself and the US. Many economists have forecasted that China’s economy will surpass that of the US in a few years.
China is the world’s number 1 manufacturer as well as exporter. In addition to being an influential player in global trade, China also houses big tech companies such as Alibaba and Baidu and continues to make essential milestones in sectors such as 5G and video streaming services. The biggest threats to the Chinese economy are the ageing population and pollution.
Germany
Nominal GDP: $4.74 trillion
GDP (PPP): $6.16 trillion
Germany is Europe’s biggest economy and the world’s third-largest by nominal GDP. The country is a major exporter of high capital goods such as automobiles, machinery, energy equipment, electronic products, branded clothing, pharmaceuticals, and chemicals. Exports account for over 40% of Germany’s economy.
Germany is home to top companies such as Volkswagen, Daimler AG, BMW, Allianz, Siemens, Deutsche Bank, and Adidas. Despite its successes, the country’s most significant source of risk is an ageing population combined with low birth rates and net immigration pressures to its social welfare system.
India
Nominal GDP: $4.19 trillion
GDP (PPP): $17.65 trillion
India is the forth-largest economy globally by nominal GDP and the third by PPP. Since the turn of the millennium, India has implemented favourable policies to grow its economy six-fold. The country now boasts the fastest growing economy in the world. India has a mixed economy that is increasingly integrated into the global economy. Its young population also raises its prospects for the future.
India is a leading producer of steel, coal, cement, and electricity. The country is a major global pharmaceutical player and tops the world in the production of generic drugs, while Its services sector is the fastest-growing, whereas agriculture and industrials remain significant employers. Despite positive prospects, its biggest source of risk is low per capita income and high unemployment rates.
Japan
Nominal GDP: $4.19 trillion
GDP (PPP): $6.74 trillion
The fifth-largest economy in the world is Japan, and it crossed the $5 trillion mark in 2019. A manufacturing and export-oriented economy, Japan has reaped the benefits of leveraging partnerships between the government and private sector and sharing knowledge between industries. A highlight of the strength and resilience of the Japanese economy is its low unemployment rates throughout history.
Japan impressively recovered from the asset bubble of the 1990s, which has been dubbed the ‘Lost Decade’. The country is well known for its automobile industry as it hosts notable brands such as Toyota, Nissan, Mazda, Suzuki, Honda, and Mitsubishi. Key risks for the Japanese economy include high levels of debt and an ageing population.
United Kingdom
Nominal GDP: $3.84 trillion
GDP (PPP): $4.45 trillion
The UK is the sixth-largest economy in the world by nominal GDP. The UK’s economy is driven by services, with London regarded as one of the world’s major financial centres. The country is home to major global financial services companies such as HSBC, Prudential, Barclays, Lloyds, Standard Chartered, and Admiral Group.
The UK boasts one of the most globalized economies in the world. The country is a major player in global trade and continues to be the EU’s leading trading partner despite exiting the trading bloc in 2016 (Brexit). The UK’s economy has, in recent years, faced political risks as well as legislative risks arising from Brexit.
France
Nominal GDP: $3.21 trillion
GDP (PPP): $4.50 trillion
France is the seventh-largest economy in the world by nominal GDP. It is the third-largest economy in the EU (behind only Germany and UK) and boasts a highly developed diversified economy. Services, industrials, and energy drive the French economy. The country’s capital, Paris, is a powerful city that contributes over a third of France’s GDP. Still, France has other leading cities like Toulouse, Marseille, Lille, and Lyon.
France is an industrial hub well known for its aerospace, telecommunications, and automobiles. It is also a leading tourist destination and the top player in nuclear energy. Some notable companies hosted in France include Total Energies, AXA, Carrefour, Peugeot, Renault, and Sanofi. Nonetheless, France faces risks of relatively high debt compared to other advanced economies and high unemployment.
Italy
Nominal GDP: $2.42 trillion
GDP (PPP): $3.80 trillion
Italy is the world’s eighth-largest economy by nominal GDP and the forth-largest in the European Union. The aftermath of World War II saw a transition from an agricultural economy to one of the most industrialized nations in the world. The drivers of the Italian economy are the metallurgical and engineering industries. Italy is also a hub for luxury products such as branded clothing and high-end cars.
Italy’s economy is driven by the industrialized northern part of the country, whereas high poverty levels characterize the southern region. Nonetheless, Italy is one of the leading custodians of private wealth globally. In recent years, its economy has suffered stagnation and faces risks such as a lack of energy sources and raw materials.
Canada
Nominal GDP: $2.23 trillion
GDP (PPP): $2.73 trillion
Canada is the ninth largest economy by nominal GDP. The Canadian economy is highly advanced and driven by services and the country’s robust energy sector. Canada boasts the third highest value of natural resources. It is a leading producer of oil and gas and metals such as Gold, Platinum, Nickel, Titanium, and Iron Ore. Its services sector is the top employer in the country and consists of robust industries such as retail, financial services, real estate, and tourism.
Canada also has an enviable location, being a neighbour of the world’s largest economy, the US. The two nations have enjoyed positive relationships for years, with Canada exporting over 75% of its products to its rich neighbour. Some of the biggest companies domiciled in Canada include Royal Bank of Canada, Canadian Natural Resources, Shopify, BCE, Thomson Reuters, Lulu lemon, and Barrick Gold.
Brazil
Nominal GDP: $2.13 trillion
GDP (PPP): $4.96 trillion
Brazil’s economy is broad-based: services dominate overall output, while agribusiness, mining and energy provide powerful external linkages.
The country is a top global supplier of soybeans, iron ore and crude oil, alongside competitive manufacturing niches (e.g., aerospace and food processing).
After a resilient 2023–2024, the IMF notes growth is moderating as inflation that re-accelerated in 2024 gradually converges toward the target; domestic demand remains the main engine, with risks from global conditions and fiscal constraints.
For traders and businesses, Brazil’s market beta is tightly tied to the global commodity cycle and China’s demand—China is a pivotal buyer of Brazilian soy and minerals—while shifting tariff regimes can be a swing factor for growth and BRL sentiment.
The IMF has flagged that additional U.S. tariffs would pose a headwind in 2025, even as Brazil deepens trade links across Asia–LATAM forums.
2023–2024 macro highlights
- United States — Disinflation continued into late-2024 while the Fed began its easing cycle in December 2024; growth stayed resilient, keeping earnings momentum uneven but intact.
- China — Growth near ~5% in 2023/H1-2024, but the property downturn persisted; Evergrande’s 2025 delisting underscored sector stress and confidence risks.
- India — The digital public infrastructure (UPI) kept scaling to record volumes through late-2024, while IMF sees robust growth with near-term moderation as capex execution normalises.
- Japan — The BoJ ended negative rates on 19 March 2024, a historic shift that, alongside wage talks, leaves JPY sensitive to policy signals and global rate spreads.
- Germany — Output contracted in 2023 on the energy-price shock; manufacturing remains soft into 2025 as competitiveness and energy costs weigh on sentiment.
- United Kingdom — Post-Brexit trade patterns show goods softness vs. resilient services; the goods share of exports hit a record low in 2025, highlighting the economy’s services tilt.
- France — A large fiscal deficit (5.5% of GDP in 2023) narrows only gradually; authorities target sub-3% by 2027, balancing consolidation with green/digital investment.
- Italy — Recovery continues, but high public debt and modest potential growth keep vulnerabilities elevated; EU-funded NRRP investment is a key support.
- Canada — Highly exposed to the S. cycle: in 2024, 76% of Canada’s exports went to the U.S., keeping CAD/TSX tightly geared to U.S. demand and tariffs.
- Brazil — Commodity-linked growth with China as the pivotal buyer (2024 exports to China ~US$94bn); BRL and equities stay highly sensitive to the global commodity cycle.
Data transparency: Cross-country context aligned to IMF WEO (April 2025); macro cross-checks from World Bank WDI and OECD where relevant.
What this means for traders
- Lower inflation and early rate cuts (US/UK/EU)
Cheaper borrowing tends to support stock markets, especially growth and tech, while major currencies can swing as interest-rate gaps narrow.
Affected instruments: S&P 500, Nasdaq-100, FTSE 100, EUR/USD, GBP/USD, major government bonds. - China’s property slowdown
Weaker construction keeps demand for some raw materials uneven and can weigh on regional growth.
Affected instruments: Copper, iron ore, AUD/USD, USD/CNH, Asian equity indices. - AI investment boom
Spending on chips, data centres and cloud services helps tech leaders, but results remain sensitive to earnings and interest rates.
Affected instruments: US tech indices, semiconductor shares/ETFs, long-duration equities. - Energy market swings
Oil supply decisions and shipping disruptions can lift fuel prices and inflation expectations.
Affected instruments: Brent/WTI, natural gas, CAD and NOK currency pairs, energy equities. - Japan’s policy shift
As rates normalise, the yen can move sharply on policy headlines or intervention talk.
Affected instruments: USD/JPY, EUR/JPY, Nikkei 225, Japan-exposed exporters. - Europe’s industrial reset
Higher energy costs and re-shoring pressures challenge manufacturers, while utilities and infrastructure can act as defensives.
Affected instruments: DAX, Euro Stoxx 50, European industrials vs. utilities. - India’s digital and investment drive
Strong domestic demand supports growth, with the currency often steadier than high-beta peers.
Affected instruments: India equity indices/ADRs, USD/INR. - Americas’ commodity link (Brazil/Canada)
Prices of soy, iron ore and oil heavily influence local markets and currencies.
Affected instruments: Bovespa, TSX, BRL and CAD pairs, key commodities (soy, iron ore, oil).
Put this into practice:
Open WebTrader, add the month’s key events to your Economic Calendar, and practise trades in a free demo account. When your plan is consistent, consider moving to a real account.
Trading on the Biggest Economies in the World
The biggest economies of the world control the global financial markets. Sign up for an AvaTrade account and access currencies, stocks, indices, commodities, and ETFs of the biggest world economies on a single platform.
Why Trade with AvaTrade?
- Global Forex & CFD Broker– AvaTrade is a reliable, regulated, and trustworthy broker licensed in various jurisdictions worldwide.
- Trading Conditions– Trade your favourite financial assets with low spreads, transparent pricing, unrestricted short selling, and fast trade execution at all times.
- Handy Resources– Enhance your trading activity by utilizing practical trading resources like AvaProtect, AvaSocial, and Trading Central.
- Professional Support – Trade with maximum peace of mind and contact the multilingual AvaTrade customer support for any kind of assistance round the clock.
FAQs
- What’s the difference between nominal and PPP GDP?
Nominal GDP is measured in current US dollars and moves with exchange rates. PPP GDP adjusts for local prices to show the real volume of goods and services. Traders look at both for a fuller picture.
- Why do GDP rankings change from year to year?
Growth, inflation, and currency swings can all move a country up or down. A weaker currency can lower a nation’s nominal rank even if its real economy keeps expanding.
- How do shifts in the top economies affect markets?
They can influence equity indices, currencies and commodities. For example, easing inflation often supports stock markets, while slower construction in a major economy can weigh on metals demand.
- Which sources should I trust for GDP data?
The IMF World Economic Outlook is the standard reference, with the World Bank, OECD and UNCTAD providing useful cross-checks on growth, trade and investment.
- How can a beginner use this information in trading?
Keep a simple watchlist of key releases (GDP, CPI, PMI), set alerts, and practise in a demo account before risking capital. Gradually connect macro trends to affected instruments (indices, FX pairs, key commodities).
See a trading opportunity? Open an account now!


