Trading Breakout Stocks

Define Breakout
A breakout happens when an asset price moves out of defined support and resistance areas with increased volume or momentum. Stocks breakouts are considered a vast source of opportunity or risk in the market. When a breakout occurs, it may be the beginning of a strong trend. Breakouts can offer huge opportunities for massive profits because they allow traders to ride out a new trend from its very beginning.
How to Find Breakout Stocks
So, how does the volume affect stock price? Like in any other market, stock prices are influenced by forces of demand and supply. Breakouts are generally preceded by a period of low volatility, where the price is contained by resistance, support, or both. This means that there is indecision among buyers and sellers.
Breakouts then occur when there is a change in the supply and demand of a stock. For instance, a stock will break a resistance level when there are more buyers than sellers at that particular time, whereas a support level will be broken when sellers outweigh buyers.
There are generally two types of breakouts: continuation breakouts and reversal breakouts. Continuation breakouts happen when a stock has been trending in a particular direction and then enters a period of consolidation. This can be a result of profit-taking or the exit of market participants.
After that period of consolidation, the stock will break out and continue in the direction of the previous trend. On the other hand, a reversal happens when a stock has been trending in one direction and then enters a period of consolidation. However, the price will break out in the opposite direction after consolidating.
Therefore, the key to determining a breakout stock is a market that is in a period of consolidation. It is a stock characterized by low volatility and will be contained by defined support and resistance levels. It can be contained in channels or even candlestick patterns, such as triangles, flags and wedges.
It is crucial to qualify the support and resistance levels. A strong and lucrative breakout will happen when strong support or resistance level has been breached. A strong support or resistance level has been tested numerous times and remained valid for a more extended period.
Most Common Breakout Patterns
Here are some of the most stock breakout patterns that can be traded in the market:
Bollinger Bands Breakout
Bollinger Bands is one of the best indicators for breakout trading. It is used as a volatility channel when tracking and timing stock breakouts. A Bollinger Bands Squeeze will highlight periods of low volatility – this is when upper and lower bands of the indicator converge, especially after a period of prolonged trends. The indicator does not provide any price breakout directional cues. Still, the return of high volatility in the market is denoted by the divergence of the upper and lower bands of the indicator.
A bullish breakout occurs when the upper band is breached, whereas a bearish breakout happens when the lower band is breached. When trading Bollinger Bands stock breakouts, the stop loss is placed above or below the opposite band of the breakout direction. For instance, in the case of a bullish breakout where the upper band is breached, the stop loss is placed below the lower band.
Cup and Handle Breakout
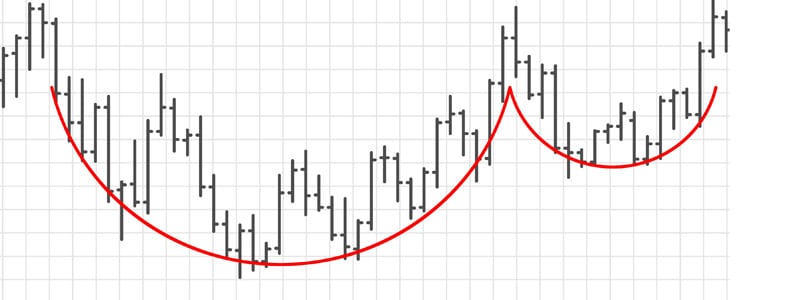
The cup and handle pattern is very popular for trading stock breakouts. There are two parts for the formation of this pattern: a cup and handle. The cup forms when the price falls from a high and then recovers to almost the same level. It forms a bowl-like shape on the chart. After the formation of the cup, the price then starts consolidating sideways, thus creating the handle.
The handle must be smaller than the cup, and ideally, it should not drop below the bottom half of the cup. The breakout occurs when the handle’s resistance is breached with high volume. When trading the cup and handle stock breakout strategy, the stop loss is placed below the handle support, whereas the profit target is the height of the cup.
More Technical Analysis Methods for Identifying Breakouts
Breakout trading hinges on the ability to spot moments when price escapes a consolidation zone with conviction.
While horizontal support and resistance lines are foundational, successful traders often combine multiple technical tools to confirm breakout validity.
Below are key technical methods used to identify and confirm breakouts with greater accuracy:
Price Action Patterns
Certain candlestick and chart patterns are known to precede breakout events:
- Ascending Triangle: Bullish continuation pattern suggesting a breakout above resistance.
- Descending Triangle: Bearish pattern signalling potential downward breakout.
- Bull/Bear Flags: Consolidation phases that lead to breakouts in the direction of the prior trend.
Volume Confirmation
Volume is one of the most reliable indicators of breakout strength. A true breakout is typically accompanied by a noticeable surge in volume—indicating institutional participation and conviction.
- Example: A breakout from a key level with 2–3x average daily volume is statistically more likely to hold than one on weak volume.
Momentum Indicators
These tools help confirm that momentum is behind the move:
- Relative Strength Index (RSI): Look for RSI crossing above 60 (bullish breakout) or below 40 (bearish).
- MACD: A bullish crossover (MACD line crossing signal line from below) near a resistance zone often supports an upside breakout.
- Stochastic Oscillator: Rapid upward crossover near oversold zones can hint at breakout momentum.
Volatility Indicators
Breakouts are often preceded by a contraction in volatility followed by an explosive move:
- Bollinger Bands: Price squeezing inside narrow bands often precedes breakouts.
- Average True Range (ATR): A spike in ATR during a move can validate breakout strength and help set stop-loss levels.
Ready to put these tools into practice?
Open a free demo account with AvaTrade and explore breakout setups with advanced charts and indicators.
Using Data to Validate Breakout Signals
While technical setups are essential, breakout strategies become significantly more effective when backed by data.
Empirical studies and backtested statistics can help traders assess the probability of success before entering a trade.
Volume-Based Breakout Validation
Several academic and institutional studies have shown that breakouts accompanied by high volume have a significantly higher success rate:
- A CFA Institute publication found that breakouts with volume greater than 150% of the 20-day average volume had a 71% chance of follow-through.
- According to a TradingMarkets study, low-volume breakouts failed to continue more than 58% of the time.
Actionable Insight: Always compare breakout volume with a recent average (e.g., 10–20-day moving average of volume) for validation.
Breakout Failure Rate by Pattern Type
Understanding the historical reliability of breakout patterns helps traders prioritise high-probability setups:
Pattern Type | Success Rate (Follow-Through ≥ 5%) |
Ascending Triangle | 68% |
Descending Triangle | 65% |
Head & Shoulders | 73% |
Double Top/Bottom | 60% |
Rectangle Breakout | 62% |
(Source: Bulkowski, The Encyclopedia of Chart Patterns)
Actionable Insight: Focus on breakout patterns with higher historical win rates, but always apply real-time confirmation tools like RSI, MACD, and volume.
Breakout Duration and Target Setting
Data also suggests most breakout moves peak within 3–5 days after the breakout. Using measured move techniques (e.g., triangle height projected from breakout point) enhances the precision of take-profit targets.
Advanced Risk Management for Breakout Trades
Breakouts may offer strong reward potential, but they can also lead to false signals and rapid reversals.
A disciplined risk management framework is essential to protect capital and sustain long-term success in breakout trading.
Stop-Loss Placement Techniques
A well-placed stop-loss helps avoid getting trapped in false breakouts:
- Below the Breakout Level: Place stop just under the breakout point (e.g., below resistance-turned-support).
- ATR-Based Stop: Use the Average True Range (ATR) to calculate a volatility-adjusted stop-loss.
Formula: Stop = Entry − (1.5 × ATR) - Below the Last Swing Low/High: For more conservative trades, place stop under the most recent swing point for extra protection.
Position Sizing Strategies
Calculate trade size to ensure consistent risk across trades:
- Fixed Percentage Risk: Risk 1–2% of your capital per trade.
- Volatility-Based Sizing: Adjust position size based on ATR to maintain consistent dollar risk even with volatile assets.
Example: With a £10,000 account and 2% risk per trade, the max loss is £200.
If stop-loss is 50 pips, your position size should be 4 lots on a standard Forex account.
Recognising Breakout Failures Early
Some breakouts fail quickly. Recognise failure with:
- Breakback Below Key Level: If price closes back below the breakout zone within 1–2 candles, consider exiting.
- Diverging Momentum: RSI or MACD failing to confirm the breakout direction may signal a false move.
- Lack of Volume: Weak or declining volume after breakout often precedes failure.
Risk-Reward Ratio
Breakout trades should ideally offer at least a 2:1 reward-to-risk ratio. Use chart patterns (e.g., triangle height) or historical price behaviour to project targets.
Protect your trades like a pro
Start with a free demo account and master risk management techniques in a risk-free environment.
How to Plan a Breakout Trade – A Step-by-Step Guide
A structured plan helps eliminate emotional decision-making and improves consistency in breakout trading.
Below is a step-by-step process to help you go from spotting a potential breakout to managing the trade effectively.
Step 1: Identify a Setup
Look for common breakout formations like:
- Ascending/descending triangles
- Rectangles or ranges
- Flags and pennants
Use trendlines or support/resistance levels to visualise key breakout zones.
Tip: Use AvaTrade’s platform drawing tools to clearly mark breakout levels.
Step 2: Confirm the Breakout Conditions
Before entering:
- Check for volume surge (ideally 1.5–2x average).
- Use RSI/MACD to confirm directional momentum.
- Wait for a clean candle close above the breakout level (not just a wick).
Step 3: Plan Entry, Stop, and Target
- Entry: After confirmation (e.g., close above resistance).
- Stop-Loss: Just below the breakout point or based on ATR.
- Take-Profit: Use a measured move (e.g., height of pattern projected from breakout).
Example: If triangle height is 100 pips, project 100 pips from the breakout point as a target.
Step 4: Calculate Position Size
- Risk no more than 1–2% of your account.
- Use a position size calculator to align stop-loss distance with your risk level.
Step 5: Execute and Monitor
- Enter the trade with preset stop and take-profit orders.
- Monitor the trade for early warning signs of failure (volume drop, false break close).
- Consider trailing your stop to lock in profits as price moves in your favour.
Apply your breakout trading plan in real markets
Open a real AvaTrade account and turn strategy into execution with precision tools and expert support.
Trade Breakout Stocks with AvaTrade
Track and trade breakout stocks with AvaTrade. Here is why:
- International Broker – AvaTrade is a reputable global broker that has been licensed and authorized in multiple jurisdictions around the world.
- Favourable Trading Conditions – Trade breakout stocks with low spreads, unrestricted short selling, transparent prices, and fast trade execution.
- Effective Tools and Resources – Trade breakout stocks on advanced AvaTrade platforms that feature comprehensive charting tools and handy resources such as AvaProtect, AvaSocial, and Trading Central.
- Excellent Support – Trade with maximum support. Contact our friendly, professional, and highly responsive customer support for any assistance.
** Disclaimer – While due research has been undertaken to compile the above content, it remains an informational and educational piece only. None of the content provided constitutes any form of investment advice.
FAQ
- What is the most reliable indicator for breakout confirmation?
Volume is often considered the most reliable indicator. A breakout accompanied by above-average volume confirms market conviction behind the move. Traders also use momentum indicators like RSI and MACD for further confirmation.
- How do I avoid false breakouts?
Avoid entering trades based on intraday spikes. Wait for a candle close beyond the breakout level and confirm with high volume and supportive momentum indicators. Using stop-losses and proper risk management is also key to limiting damage from failed breakouts.
- Which chart patterns have the highest breakout success rates?
According to historical data, Head & Shoulders and Ascending Triangle patterns have relatively high breakout success rates (above 65%). However, market context, volume, and timing remain critical factors.
- What’s the best time frame for breakout trading?
Breakouts occur across all timeframes, but many traders prefer the 1-hour to daily range for a balance of clarity and trade frequency. Higher timeframes generally yield more reliable signals with lower noise.


