Harmonic Patterns

Trading chart patterns are the foundation of technical analysis. There are numerous types of patterns, and it is not really necessary for technical analysts to master them all. Rather, it is important to understand how they form and what message they convey. Price patterns illustrate how an asset’s price reacts to support and resistance lines or areas in the market, including trendlines. Trading patterns can signal transitions between different market conditions, such as uptrends and downtrends, or a continuation of prevailing conditions. When understood, traders are able to use trade patterns to anticipate future price behaviour and to take advantage of lucrative trade opportunities in the market.
Harmonic patterns are some of the most efficient and effective trading patterns in technical analysis. Compared to other patterns, they are more advanced and can help technical analysts decipher even more price action information in the markets. They combine raw price action analysis with the mathematical tool, Fibonacci, to create geometrical structures that provide more qualified trading opportunities in the markets. Harmonic patterns essentially allow traders to view order in chaotic price action and to appreciate how price swings and retracements correlate with Fibonacci sequences. Harmonic patterns generate powerful, high probability trading signals with clear entries, stops, and targets that are likely to offer attractive risk/reward ratios.
Historical Foundations of Harmonic Patterns
Harmonic patterns trace their origins to the early 20th century, when pioneering technical analyst H.M. Gartley introduced the concept in his landmark 1932 book Profits in the Stock Market. Gartley’s observations revealed that recurring geometric price structures — combined with specific Fibonacci ratios — could forecast high-probability reversal points. The “Gartley 222” pattern, named after the page on which it first appeared, became the blueprint for this trading approach.
Decades later, Scott Carney expanded and refined Gartley’s work in his Harmonic Trading series (from 1999 onwards), introducing well-known variations such as the Bat, Butterfly, Crab, and Shark patterns. Carney codified precise Fibonacci measurements for each structure, bringing greater consistency to identification and execution.
Today, harmonic patterns benefit from modern charting platforms, automated recognition tools, and advanced data analysis — allowing traders to apply a once highly manual method with far greater speed and accuracy. While the theory is rooted in classic chart reading, the integration of Fibonacci mathematics and technology makes it a bridge between traditional technical analysis and modern algorithmic trading.
Discover how harmonic patterns fit into your trading strategy — open a free AvaTrade demo account today and start identifying patterns in real time.
Mechanics of Harmonic Patterns
Harmonic patterns are designed to identify quality turning points in the market. To be considered valid and tradable, harmonic patterns must meet defined movement conditions based on Fibonacci retracements and extension levels. Fibonacci retracements are used to determine levels where the price is likely to resume the direction of the dominant trend, whereas Fibonacci extensions are used to determine high probability price targets in a trending market.
ABCD Pattern
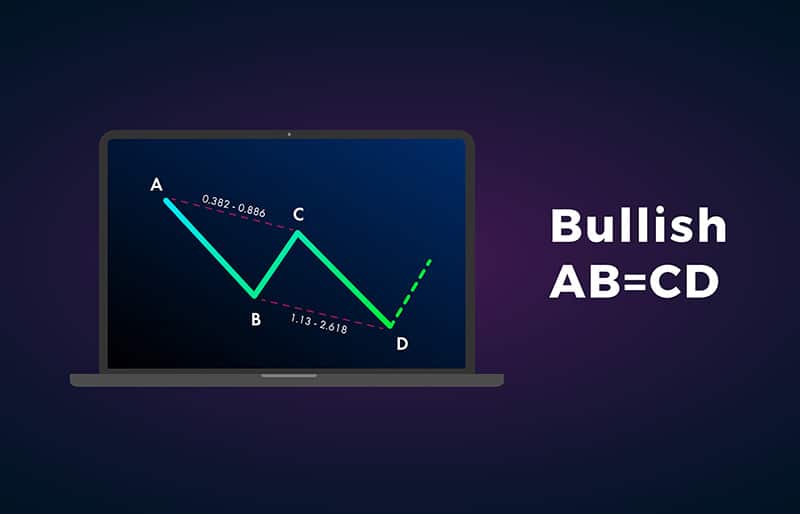
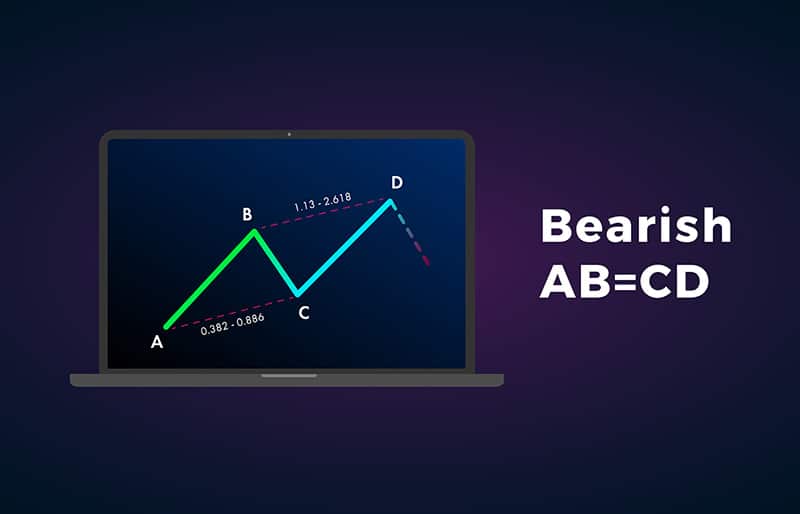
The classic ABCD pattern forms the basis of all harmonic patterns. This pattern consists of the impulsive AB movement, which is followed by the retracement move BC, and finally another impulsive movement CD.
When using the Fibonacci retracement tool, the BC leg should ideally be a 0.618 (or lower) retracement of the impulsive AB leg. The final CD movement will then be roughly the same size as the first impulsive AB movement.
To trade the ABCD pattern, traders can enter trades after the BC corrective phase so as to ride the CD impulsive phase. Alternatively, they can wait for the whole pattern to be completed so as to trade the expected reversal at point D.
Types of Harmonic Patterns
BAT Pattern
The BAT pattern contains the ABCD pattern, in addition to an extra price point labelled X, which precedes the ABCD movement. The entire pattern resembles a ‘bat’, and it can either be bullish or bearish.
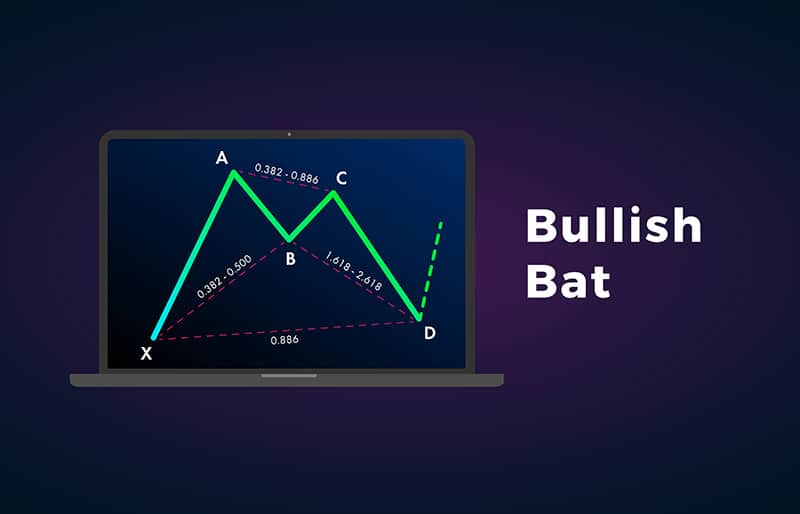
A bullish BAT pattern will resemble an ‘M’. It forms as follows:
- A price moves sharply higher from point X to A. XA is the longest leg of the pattern.
- AB will then retrace less than 0.618 of XA. The ideal retracement levels will be between 0.382 and 0.50.
- BC will then retrace between 0.382 and 0.886 of AB.
- CD will finally be an extension between 1.618 and 2.618 BC. Point D should be about a 0.886 retracement of point X.
An asset’s price is expected to reverse at D. A buy order will be placed there with a stop below X. Profit targets will be Fibonacci levels between A and D.
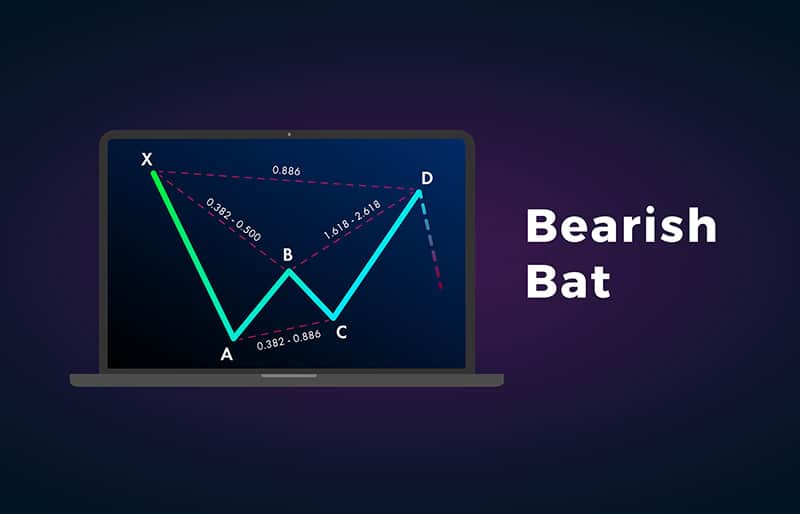
A bearish BAT pattern will be the reverse of the bullish pattern and will resemble the letter ‘W’, with the initial leg being a sharp decline from X to A. At point D, a sell order will be placed with a stop above X and profit targets being Fibonacci levels between A and D.
Gartley Pattern
The Gartley pattern resembles the BAT pattern, but it demands slightly different conditions for the movements. The two conditions that must be met are:
- Point B must be precisely around 0.618 of XA
- Point D must be precisely around 0.786 of XA
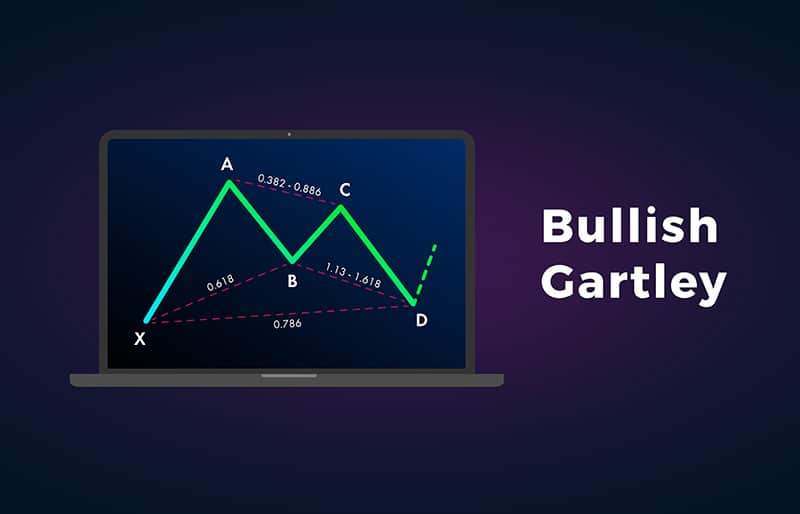
A bullish Gartley pattern will also resemble an ‘M’ and buy orders will be placed at D and stops at or below X, with the profit target at C.
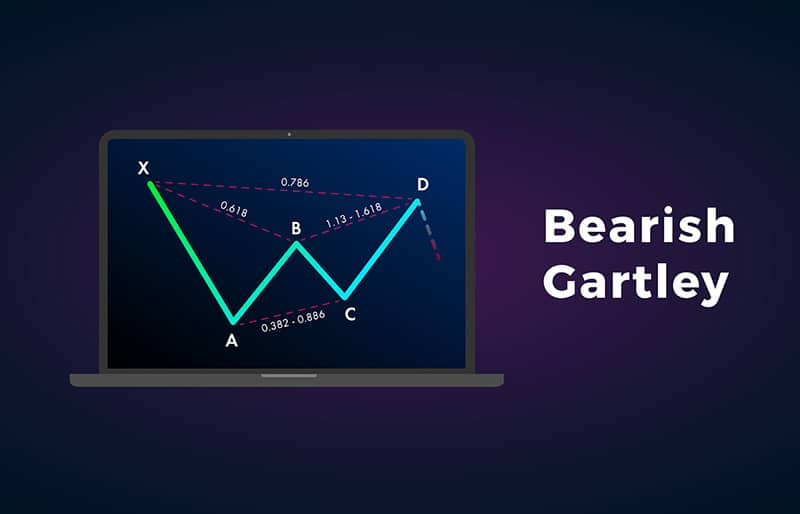
Similarly, a bearish Gartley pattern will resemble a ‘W’, and sell orders will be placed at D and stops at or above X with the profit target at C. Additional profit targets will be Fibonacci retracement and extension levels of AD.
Butterfly Pattern
The butterfly harmonic pattern also features the XABCD price movement legs, but with some key characteristics that distinguish it from the above two patterns. They include:
- AB retraces about 0.786 of XA
- CD is an extension of between 1.618 and 2.24 of AB
- In a bullish pattern, point D is lower than point X; and in a bearish pattern, point D is higher than point X.
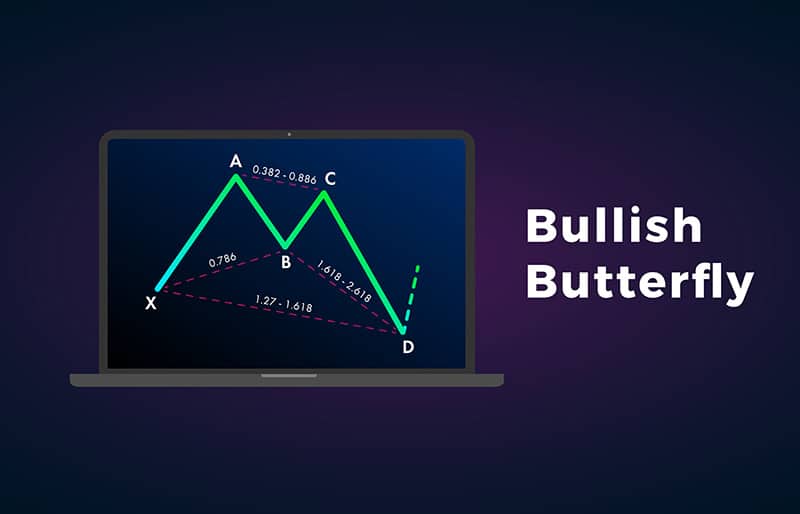
When a bullish butterfly pattern forms, traders will place buy orders when the price appreciates off point D. Stops will then be placed below the swing point D, with profit targets based on Fibonacci levels derived from AD.
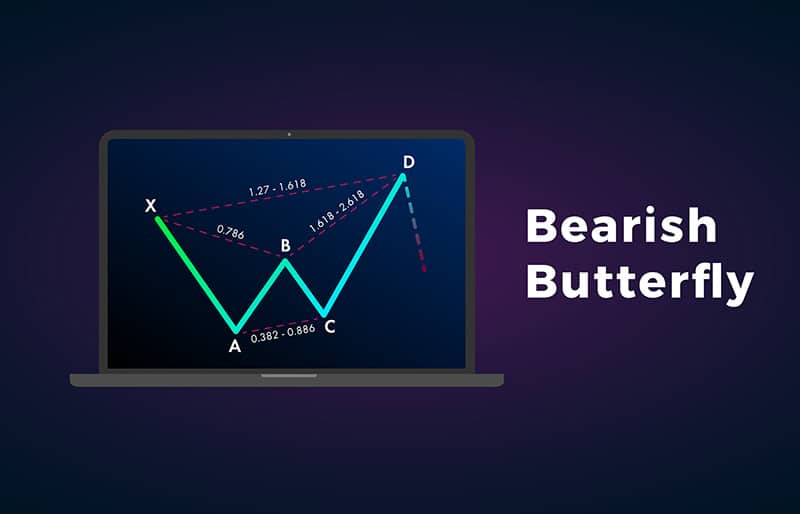
Similarly, when a bearish butterfly pattern forms, sell orders will be placed when the price moves lower off point D. Stops will be placed above swing point D, with profit targets placed on Fibonacci levels projected from AD.
Crab Pattern
The Crab pattern is similar in structure to the butterfly pattern. Its distinguishing features are:
- CD is an extension of between 2.618 and 3.618 of BC
- Point D is an extension of about 1.618 beyond XA
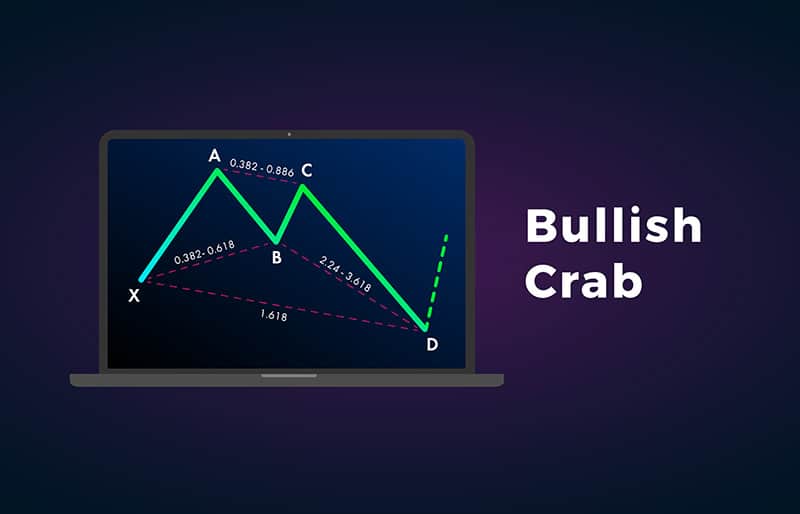
When a bullish crab pattern forms, traders will look to place buy orders when the price starts to rise off point D. Stops will be placed below swing point D, with profit targets being Fibonacci levels of AD.
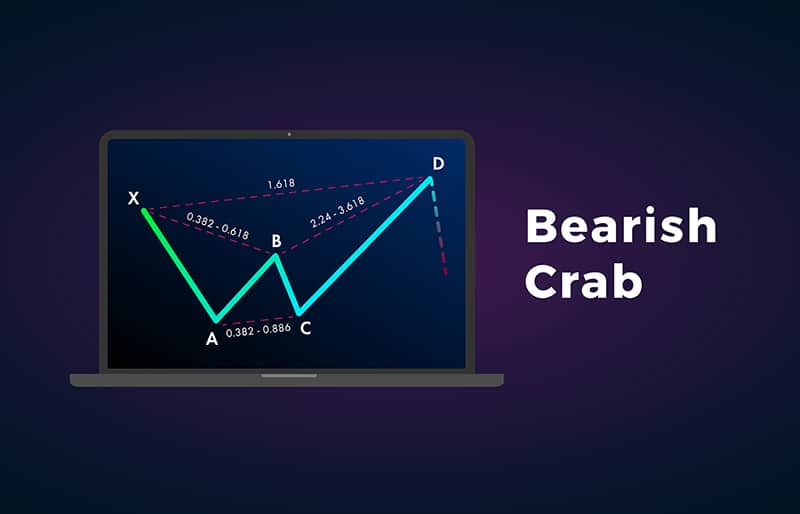
In the same manner, when a bearish crab pattern forms, traders will look to place sell orders when the price starts to fall off point D. Stops will be placed above swing point D, with profit targets being Fibonacci levels of AD.
Cypher Pattern
The distinguishing features of the cypher harmonic pattern include:
- AB retraces between 0.382 and 0.618 of XA
- Point C extends beyond point A by at least 1.272, but not more than 1.414
- Point D does not extend beyond 0.786 of point X
In a bullish cypher pattern, X is the pattern low, while C is the pattern high. Buy trades are entered at point D, with the stop at or below X, and profit targets at A and Fibonacci retracements of CD.
In a bearish cypher pattern, X is the pattern high, while C is the pattern low. Sell trades are entered at point D, with the stop at or above X, and profit targets at A and Fibonacci retracements of CD.
Practical Tools for Identifying Harmonic Patterns
Spotting harmonic patterns manually requires careful measurement of Fibonacci retracements and extensions. Fortunately, AvaTrade’s MetaTrader 4 (MT4) and MetaTrader 5 (MT5) platforms make this process faster and more precise.
Using Fibonacci Tools in MT4/MT5
- Select the Fibonacci Retracement tool from the toolbar.
- Plot retracement levels from the swing high to swing low (or vice versa) to check key ratio alignments, such as 61.8%, 78.6%, or 88.6%.
- Use the Fibonacci Expansion tool to project potential completion points for the final leg of the pattern.
Harmonic Pattern Indicators and Scripts
- Custom Indicators: Traders can install harmonic pattern indicators from the MT4/MT5 marketplace to automatically scan and label patterns such as Gartley, Bat, or Butterfly.
- Pattern Validation Alerts: Many scripts can alert you when price reaches the potential reversal zone (PRZ), helping you avoid missed opportunities.
Recommended Best Practice
Even with automation, confirm each pattern visually to ensure it meets the precise Fibonacci criteria. Combining software detection with your own chart analysis increases accuracy and reduces false signals.
Limitations of Harmonic Patterns
Like every other strategy, harmonic patterns are no holy grail; they have their limitations. Some of the disadvantages of harmonic patterns include:
- They Are Subjective
The success of harmonic patterns largely depends on the proper identification of the initial XA impulsive move. This is the foundation of all harmonic patterns, and it is the most subjective decision of all. At any given time, there are many impulsive moves on a chart, and plotting the correct one is not an easy task. Additionally, it is easy for traders to try to ‘force’ the market to conform to their pattern. - Easy To Miss Big Trends
It takes patience for traders to see out the formation of any harmonic pattern on a chart. In some of the patterns, some legs constitute massive price movements, and traders can miss out on such big trends as they wait for the formation of a complete pattern. - Can Be Ineffective in Ranging Markets
Due to the nature of their formation, harmonic patterns can easily occur in ranging markets. But their success rate is so low in such markets, and their formation can lead to the generation of low quality, low probability trading signals. - Stop Hunts
Harmonic patterns have defined areas for stop placement. But the stops are really tight and can easily be triggered in volatile markets.
Applied Learning Steps
To build skill and confidence in harmonic trading, practical application is essential. Below are hands-on exercises you can try using a live or demo AvaTrade account.
Exercise 1: Pattern Spotting on a 4-Hour Chart
- Choose a major currency pair, such as EUR/USD.
- Scan the last three months of 4-hour data for any potential Gartley or Bat patterns.
- Use Fibonacci retracements to confirm ratio compliance before logging the trade idea.
Exercise 2: Backtesting for Consistency
- Pick one harmonic pattern (e.g., Butterfly) and test its performance across 10 historical examples.
- Record entry price, stop loss, and target levels for each.
- Review the results to identify win rate, risk/reward ratios, and any recurring weaknesses.
Exercise 3: Pattern-Plus-Confluence
- Combine harmonic pattern identification with a secondary technical signal — such as RSI divergence or a major support/resistance level.
- Note how confluence impacts trade outcomes compared to harmonic patterns alone.
By regularly practising these steps, you’ll deepen your ability to recognise high-quality setups and improve your decision-making in real market conditions.
Risk Management in Harmonic Trading
While harmonic patterns can highlight high-probability reversal zones, no setup is foolproof. Applying disciplined risk management is essential to protect your capital and maximise long-term returns.
Position Sizing
Determine your position size based on a fixed percentage of your trading capital (e.g., 1–2% per trade). This prevents a single losing trade from having an outsized impact on your account.
Stop Loss Placement
Place your stop loss beyond the pattern’s invalidation point. For example, if a bullish Gartley completes at the 78.6% retracement, position your stop just below the next Fibonacci level or a key support zone to avoid premature exits.
Target Setting
Use the pattern’s projection ratios — such as 38.2% and 61.8% retracement of the final leg — as primary profit targets. Scaling out in stages can help lock in gains while leaving room for extended moves.
Adding Confluence
Increase trade reliability by combining harmonic setups with additional confirmation signals, such as:
- RSI or MACD divergence
- Key support/resistance levels
- Trendline bounces or breakouts
This layered approach helps filter out low-quality patterns and improves win rates.
Trade harmonic patterns with confidence — open a live AvaTrade account and apply professional risk management techniques in real market conditions.
Common Mistakes and How to Avoid Them
Even experienced traders can misapply harmonic patterns if they overlook key principles. Here are the most frequent pitfalls — and how to sidestep them.
- Overfitting Fibonacci Ratios
Some traders adjust Fibonacci levels to “force” a pattern to fit, even when the market structure doesn’t fully comply.
Solution: Stick to the precise ratio requirements for each harmonic pattern and reject any that don’t meet them exactly.
- Ignoring Market Context
A pattern may appear perfect technically, but fail if it forms against a strong trend or near major news events.
Solution: Always assess the broader market environment, including trend direction and economic calendar events, before acting.
- Trading Every Pattern You See
Not all patterns are worth trading. Taking every signal can lead to overtrading and inconsistent results.
Solution: Apply strict selection criteria, favouring patterns with multiple confirmations such as support/resistance confluence or momentum divergence.
- Neglecting Risk Management
Entering without a stop loss or risking too much capital can quickly erode your account.
Solution: Pre-define your risk per trade and set protective stops according to the pattern’s invalidation level.
By avoiding these mistakes, traders can maintain a disciplined approach and extract greater value from harmonic analysis.
Next Steps with AvaTrade
Harmonic patterns combine the elegance of Fibonacci mathematics with the discipline of structured chart analysis — but their real value comes from consistent practice and execution. AvaTrade gives you the technology, education, and support you need to take these patterns from theory to profitable application.
With MT4 and MT5, you can access:
- Built-in Fibonacci tools for precise measurement
- Custom harmonic pattern indicators and alerts
- Advanced charting for multi-timeframe analysis
Pair this with AvaTrade’s comprehensive educational resources, including step-by-step guides, webinars, and real-time market insights, and you have the foundation for confident harmonic trading.
Whether you’re refining your skills on a risk-free demo account or applying strategies in a live market, AvaTrade ensures you trade with the tools and knowledge that keep you ahead.
Experience the power of harmonic trading with AvaTrade. Sign Up Now.
FAQ
- What are harmonic patterns in trading?
Harmonic patterns are chart formations based on Fibonacci ratios that help predict potential market reversals.
- Do I need special tools to spot harmonic patterns?
Not necessarily — but using MT4/MT5 with Fibonacci tools or harmonic indicators can make pattern recognition much easier.
- Which harmonic pattern is best for beginners?
The Gartley pattern is a good starting point as it’s one of the most common and easier to validate.
- Can I practise harmonic trading without risking money?
Yes — you can open a free AvaTrade demo account and test your strategies in real-time market conditions risk-free.


